Key functionalities:
- Project and Program Repository - Project Portfolio Management (PPM)
- Project increment management, milestone management
- Declaration of increment and project impacts on IT components (applications, data flows, servers, etc.)
- Visualization of project impacts on an application or a functional domain
- Summary of transformation impacts on the IT Landscape
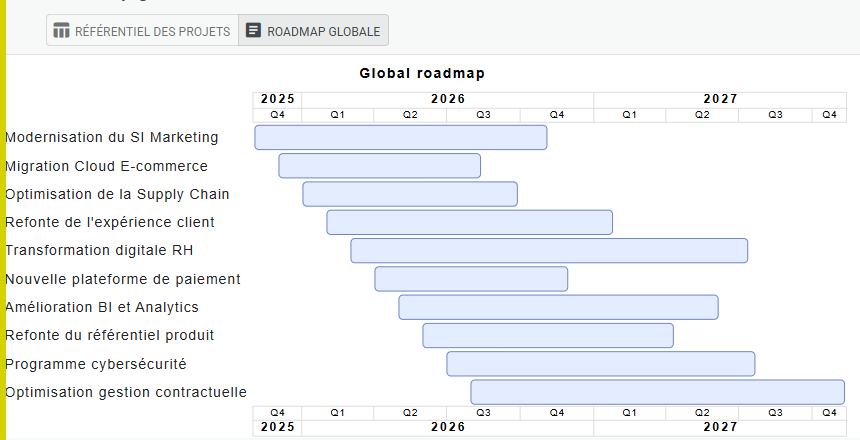
USE CASE
IT System Transformation Through Projects
IT Live Maps enables you to model IT system transformation driven by projects and programs — either independently using a flexible model that supports projects at various scales (program, project, sub-project), or in collaboration with a dedicated external PPM tool.
The strength of IT Live Maps lies in the automatic generation of maps, their automatic updates following a single data maintenance action, and cross-exploration across multiple perspectives (projects & applications, projects & functional zones, projects & infrastructure, projects & data, etc.).
- Once projects are described in IT Live Maps, link them to any IT component to visualize the impact of a given project — or conversely, see all projects affecting a specific component. Existing maps are automatically updated and allow you to visualize the evolution step by step, based on project increment scheduling.
- Quickly initialize your data flow mapping from your Excel project file, then re-export project flows to track interface delivery with your integrator.
- Create project-specific maps to focus on the project scope, and define flow sequences useful for test scenarios. These maps always stay up to date from the underlying data, remaining consistent with objects maintained within the APM (Application Portfolio Management) framework or the flow repository.